Materiales de referencia y comparaciones interlaboratorios
79
III. Results
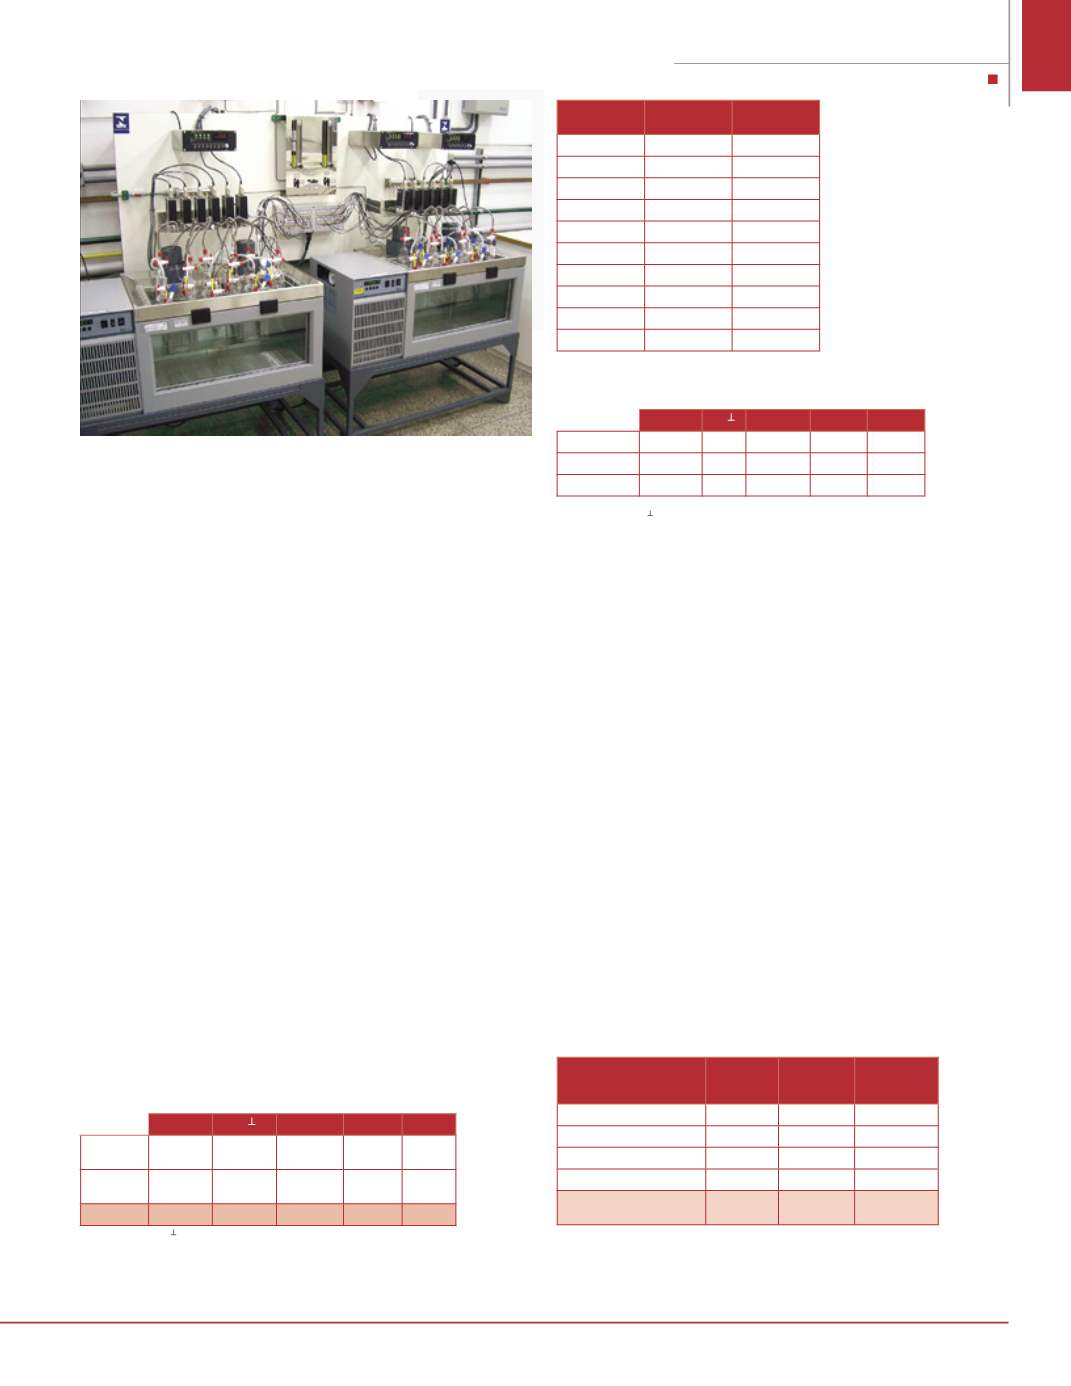
Firstly the buffer solution was characterized by the primary pH
measurement system.In Figure 3, it can be seen the primary pH
system at INMETRO, which consists of two thermostatic baths
inside of each there are six Harned cells.The measurement pro-
cedures using the primary pH measurement system has been
described elsewhere [1]. The pH primary measurements were
carried out at 25.0
o
C and the value obtained for the pH buffer
was 4.007 with an uncertainty of 0.008.This characterization of
the material was important to determine its nominal value and
to contribute with a low uncertainty to the final uncertainty of
the CRM.
The analysis of variance for the homogeneity test are shown in
Table 1.The results include analysis between bottles and within
bottle. It is presented the sum of squares (SS), the degrees of
freedom (GL), the mean square (MS), the calculated F (F
C
) and
the F-table (F
T
). As F
C
was lower than F
T
to 95% of confidence, it
can be stated that there is not a significant difference between
bottles, which proves that the material is homogeneous [7].
Once the homogeneity of the material was verified, the stabil-
ity tests were conducted.
Table 2 presents the results of pH measurement as function of
time, during 161 days of test. It is shown the mean of five mea-
surements carried out with the glass electrode, and its respec-
tive standard deviation.
In Table 3 it can be seen the variance analysis of the residues
accomplished during the 161 days in the bottles chosen ran-
domly. It is presented the sum of squares (SS), the degrees of
freedom (GL), the mean square (MS), the F and the P-value.The
P-value of the linear regression was of no significance, as it was
bigger than 0.05, to a confidence level of 95%. This fact points
out the stability of the material.
Figure 3 . The primary pH system at INMETRO.
SS*
GL
MS
#
FC
FT
Between
bottles
2.32x10
-6
3
7.72 x10
-7
0.032
2.839
Within
bottle
9.63x10
-4
40
2.41 x10
-5
Total
9.65x10
-4
43
*SS = Sum of squares; GL = Degrees of freedom;
#
MS = Mean Square
Table 1. Variance analysis to verify the material homogeneity.
Time (days)
Mean
Standard
deviation
0
4.0076
0.0003
7
4.0049
0.0002
15
4.0017
0.0004
21
4.0159
0.0007
35
4.0072
0.0003
49
4.0072
0.0003
63
4.0103
0.0012
84
4.0044
0.0013
105
4.0028
0.0007
161
4.0084
0.0010
Table 2 . pH measurement results obtained
during the stability test.
SS*
GL
MS
#
F
P-value
Regression 7.59x10
-7
1
7.59x10
-7
0.04059 0.84543
Residual
0.00015
8
1.87x10
-5
Total
0.0015
*SS = Sum of squares;
GL = Degrees of Freedom;
#
MS = Mean square
Table 3. Variance analysis of the residues to verify the stability
of the RM.
Once the homogeneity and stability tests were performed and the mate-
rial considered homogeneous and stable after the statistical analysis of
the results, it was possible to estimate an uncertainty for the material
based on the combination of three sources of uncertainty: one obtained
from the characterization method, which was the primary pH measure-
ment; a second one coming from the homogeneity evaluation and the
third, resulted from the stability analysis. Table 4 shows the uncertainty
budget of the candidate for CRM of pH 4.00.The uncertainty declared in
the certificate is based on the combined uncertainty multiplied by the
coverage factor, k=2, to a confidence level of 95% [4]. Due to the study
performed, the property value for the CRM of potassium hydrogen
phthalate buffer was determined as being 4.007
±
0.022, at 25.0 ºC, for a
shelf life of twelve months.
IV. Discussion
Some statistical tests were used to evaluate the results from the homo-
geneity and stability tests of the RM to be certified.The variance analysis
(ANOVA) and Cochran test were used to verify the homogeneity of the
variances.With the Grubbs test it was possible to accept the data and the
analysis of residues was a tool to qualify the stability of the batch [8].
The homogeneity test is important to access the physical and chemical
properties of the material. It can be demonstrated by the homogeneity
of the group of bottles and also the homogeneity inside each bottle.The
Estimate
Standard
uncertainty
u(x
i
)
Sensibility
coefficient
c
i
Contribution
u(y
i
)
Homogeneity
0.0028
1
0.0028
Stability
0.0103
1
0.0103
Characterization
0.0038
1
0.0038
Combined uncertainty
0.011
Expanded uncertainty
0.022
(
k
=2; 95%)
Table 4 – Uncertainty budget for a candidate CRM for potassium
hydrogen phthalate buffer.


